
📊 Full opportunity report: Bitcoin Battles Unfold In Live Warzone Visualization on ThorstenMeyerAI.com — validation score, market gap, and execution plan.

Get privacy and security gear delivered free with Prime
- Fast, free delivery on millions of items
- Prime Video, Amazon Music and more included
- Member-only deals all year
TL;DR
A groundbreaking project visualizes Bitcoin trading activity as a live warzone, transforming market data into an immersive cinematic experience. It connects directly to Binance and Coinbase streams, providing real-time, browser-based visualization without backend infrastructure.
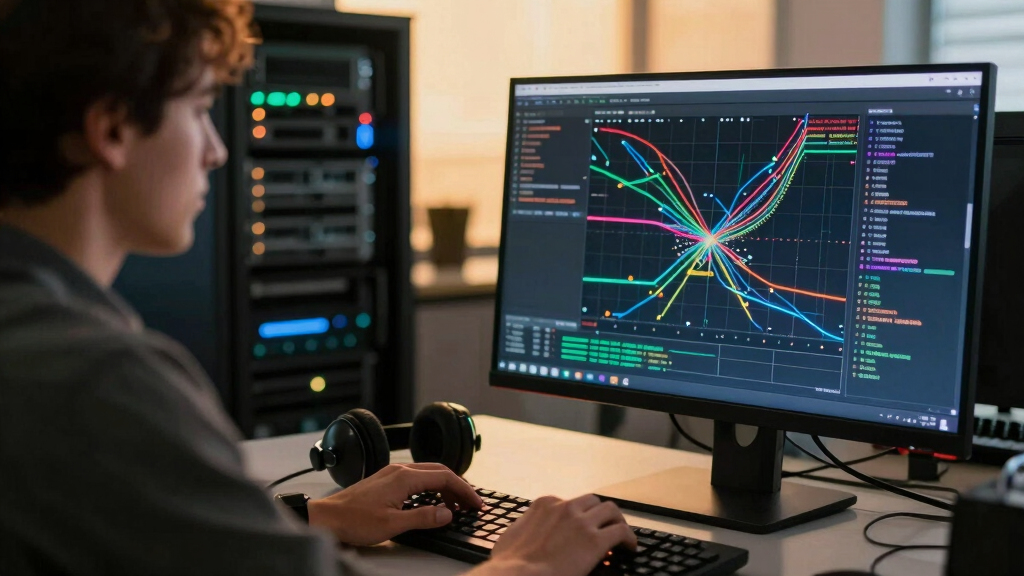
isbitcoindead.com has launched a browser-based visualization tool that depicts real-time Bitcoin trades as a cinematic battlefield, with no clear winner in sight. The project connects directly to live trade streams from Binance and Coinbase, offering an immersive, artistic view of market activity. This development highlights innovative use of web technologies to visualize complex data in an engaging format.
The Bitcoin War visualization converts every market tick into a combatant, with buy orders represented as advancing forces from the left and sell orders from the right. Large liquidations are visualized as airstrikes, and the entire scene is rendered using Canvas 2D graphics, WebAudio synthesis, and real-time stream processing, all client-side. The system features an automatic camera that shifts perspectives, a live DEFCON meter indicating volatility, and a scrolling war log narrating ongoing activity. Importantly, the project is not a trading tool—it does not involve wallets, signals, or advice, emphasizing its artistic and data visualization purpose.
Developed with a minimal footprint of roughly 180KB, the visualization runs instantly in any modern browser and is accessible for free at war.isbitcoindead.com. The creators aim to offer a visceral, cinematic perspective on Bitcoin market dynamics, blending technology and art to illustrate the chaos and tension inherent in trading.
Implications for Market Perception and Data Visualization
This project demonstrates how advanced web technologies can be harnessed for artistic and educational purposes, providing a new lens through which to interpret market activity. It offers a visceral, engaging way to understand the chaos and competition in Bitcoin trading, potentially influencing how traders, analysts, and enthusiasts perceive market volatility and dynamics. While purely visual and not a trading tool, it underscores the growing intersection of art, data science, and technology in financial markets.
Bitcoin trading visualization software
As an affiliate, we earn on qualifying purchases.
As an affiliate, we earn on qualifying purchases.
Innovative Web Tech Meets Market Data in Visual Art
Traditional market visualization tools focus on charts and numbers, but this project pushes into creative territory by transforming live trade data into a cinematic war scene. The concept builds on recent advances in browser-based graphics and real-time data streaming, showcasing how modern web browsers can handle complex visualizations without backend servers. The project is part of a broader trend toward immersive, data-driven art forms that make complex information accessible and engaging.
“This visualization offers a new way to experience market activity, making the chaos tangible and visceral.”
— an anonymous researcher
real-time cryptocurrency market display
As an affiliate, we earn on qualifying purchases.
As an affiliate, we earn on qualifying purchases.
Details on Data Accuracy and Future Updates
It is not yet clear how accurately the visualization reflects the underlying market data or whether future updates will incorporate additional features. The project emphasizes artistic expression over trading signals, and its long-term development remains uncertain.
As an affiliate, we earn on qualifying purchases.
Potential Expansions and Community Engagement
Future steps may include expanding visualization features, integrating more data sources, or adding interactive elements. The developers may also seek feedback from the community to refine the experience and explore additional creative applications of real-time market data.
cryptocurrency market data visualization
As an affiliate, we earn on qualifying purchases.
As an affiliate, we earn on qualifying purchases.
Key Questions
Is this tool meant for trading decisions?
No. The visualization is purely artistic and data-driven, not designed to provide trading signals or advice.
How does it connect to live market data?
It connects directly to Binance and Coinbase trade streams via WebSocket, with automatic fallback options to ensure continuous data flow.
Can I customize the visualization or view different markets?
Currently, the tool is focused on BTC/USDT trades. Customization options or additional markets are not yet available but could be considered in future updates.
Is it accessible on all devices?
Yes, it runs in any modern web browser, making it accessible across desktops, tablets, and smartphones.
What is the purpose of this project?
Its primary goal is to provide an artistic, visceral visualization of Bitcoin market activity, illustrating the chaos and competition inherent in trading through cinematic graphics and sound.
Source: ThorstenMeyerAI.com
Columbus Day / Indigenous Peoples' Day Picks
long weekend sales
As an affiliate, we earn on qualifying purchases.