
📊 Full opportunity report: Bitcoin Battles Unfold in Live Warzone Visualization on ThorstenMeyerAI.com — validation score, market gap, and execution plan.

Get privacy and security gear delivered free with Prime
- Fast, free delivery on millions of items
- Prime Video, Amazon Music and more included
- Member-only deals all year
TL;DR
A new web-based project visualizes Bitcoin trading activity as a live war scene, showing the ongoing battle between buyers and sellers. It uses real-time data from Binance and Coinbase, offering an immersive, artistic view of market chaos. The project is accessible for free and does not provide trading advice.
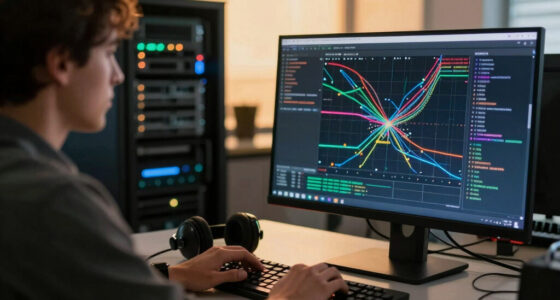
A new browser-based visualization has been launched that transforms live Bitcoin trading data into a cinematic battlefield, illustrating the ongoing tug-of-war between buyers and sellers in real time. The project, created by isbitcoindead.com, offers an immersive, artistic depiction of market activity without providing trading signals or advice. This development is significant for both the crypto community and digital art enthusiasts, as it demonstrates how advanced web technologies can be used for creative data visualization.
The Bitcoin War visualization connects directly to the public Binance trade stream via WebSocket, with a fallback to Coinbase, ensuring continuous real-time data flow. Every trade becomes a combatant—buy orders from the Cobalt Host push the front line from the left, while sell orders from the Ember Legion push back from the right. Large liquidations are visualized as airstrikes, adding a visceral element to the display. The entire system runs client-side, utilizing Canvas 2D graphics, WebAudio synthesis, and stream processing, with a minimal footprint of approximately 180KB.
The platform features an automatic camera system that shifts perspectives, from broad overviews to detailed skirmishes, and displays a live DEFCON meter indicating market volatility. A scrolling war log narrates ongoing activity, and a synthesized soundtrack enhances the experience. The visualization also includes a comprehensive scoreboard tracking seconds won, casualties, and dollar gains, creating a vivid narrative of market dynamics. Importantly, the project explicitly states it is not a trading tool, emphasizing its artistic and educational purpose.
Implications of Visualizing Market Chaos as Warfare
This project highlights the potential of web-based technologies to create immersive, artistic representations of complex financial data. For the crypto community, it offers a novel way to conceptualize market volatility and trading activity, making the abstract chaos more tangible. It also raises questions about the intersection of art, data visualization, and financial markets, prompting discussions on how technology can reshape our understanding of trading dynamics. While purely visual and non-advisory, the project underscores the intense, competitive nature of crypto trading, captured through a visceral, cinematic lens.
Bitcoin trading visualization software
As an affiliate, we earn on qualifying purchases.
As an affiliate, we earn on qualifying purchases.
Background of Market Visualizations and Web Tech Innovation
Traditional market data visualization tools focus on charts, graphs, and numerical indicators. However, recent innovations have explored more immersive approaches, including art-driven and interactive displays. The launch of this Bitcoin War visualization builds on advancements in browser technology—particularly WebSocket streaming, Canvas graphics, and WebAudio—that enable complex, real-time visualizations without backend infrastructure. The project also reflects a broader trend of using digital art to interpret and dramatize financial markets, making data more accessible and engaging for broader audiences.
“This visualization demonstrates how web tech can turn raw trading data into an immersive narrative, offering a new perspective on market volatility.”
— an anonymous researcher
cryptocurrency market data display
As an affiliate, we earn on qualifying purchases.
As an affiliate, we earn on qualifying purchases.
Unconfirmed Aspects and Limitations of the Visualization
While the visualization is live and accessible, it is primarily an artistic representation and does not provide any trading signals or advice. It is not clear how accurately it reflects actual market conditions beyond visual dramatization. Additionally, the long-term stability and scalability of the platform remain untested, and there is no indication of plans for commercial or analytical integration. The impact of such visualizations on trader behavior or market perception is also still unstudied.
As an affiliate, we earn on qualifying purchases.
Future Developments and Potential Expansions
The creators may expand the visualization’s features, such as adding more detailed analytics or interactive elements. There could also be efforts to incorporate additional data sources or enhance the cinematic effects. As the project gains attention, discussions around its educational and artistic applications are likely to grow. Monitoring user engagement and feedback will be key to understanding its evolving role in crypto visualization and digital art.
As an affiliate, we earn on qualifying purchases.
Key Questions
Is the Bitcoin War visualization a trading tool?
No, it is purely an artistic and data visualization project. It does not provide trading signals, advice, or wallet integration.
How does the visualization connect to real-time market data?
It connects directly to Binance’s public WebSocket trade stream, with a fallback to Coinbase, to visualize live BTC/USDT trades.
Can I customize or interact with the visualization?
Currently, the visualization is a fixed, automated display designed for viewing, not interaction or customization.
Is this visualization available for free?
Yes, it is freely accessible at war.isbitcoindead.com and runs instantly in any modern browser.
What is the purpose of this project?
The project aims to provide a visceral, artistic depiction of market activity, illustrating the chaos and competition inherent in Bitcoin trading.
Source: ThorstenMeyerAI.com
Columbus Day / Indigenous Peoples' Day Picks
long weekend sales
As an affiliate, we earn on qualifying purchases.