
TL;DR

Get privacy and security gear delivered free with Prime
- Fast, free delivery on millions of items
- Prime Video, Amazon Music and more included
- Member-only deals all year
East-west traffic is communication between services, workloads, or systems within a data center, cloud environment, or enterprise network; north-south traffic generally crosses that environment’s boundary. Mapping internal flows helps you understand application dependencies, spot performance problems, and limit unnecessary access, while combining flow records, application telemetry, and selective inspection gives useful visibility without collecting every packet.
A customer taps “Place order,” and a quiet burst of conversations begins: the web service calls an API, the API checks inventory, a cache answers, and a database records the purchase. Those exchanges can happen in milliseconds, hidden behind a page that simply says, “Thanks for your order.”
That inside-the-application conversation is east-west traffic. It helps you understand why a service is slow, which systems depend on each other, and what a compromised workload might be able to reach. It does not mean every internal connection is suspicious; it means those connections deserve the same clear thinking you give traffic crossing the network boundary.
This guide explains how to identify east-west traffic, read a traffic map without mistaking it for the whole story, and choose useful monitoring and access controls. You’ll also see why the right approach depends on your architecture, privacy needs, and the questions you need to answer.
East-west traffic means communication inside a chosen network boundary; say which boundary you mean when discussing a flow.
An internal connection is not automatically trusted. Use service identity, least privilege, and segmentation to limit unnecessary access.
Start monitoring with one important application and a concrete question; combine flow records with logs or traces for context.
A sudden traffic change can reflect a release, retries, congestion, or an unauthorized connection, so check ownership and timing before acting.
Choose controls your team can operate. A small allowlist may fit a home lab, while dynamic platforms may need workload-aware policy.
Network field guide / 01
How to Think About East-West Traffic
Inside an application, services quietly call services. Map those conversations to understand dependencies, find slow paths, and limit unnecessary access—without assuming every internal connection is a threat.
01 / Read the direction
What a traffic map can tell you
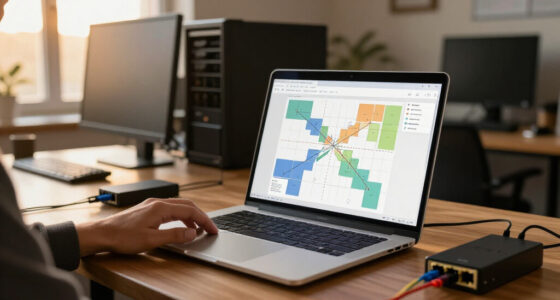
A visitor’s request may enter from outside, then trigger a chain of internal calls. Those service-to-service exchanges are east-west traffic within the chosen environment. A map helps you see who calls which dependency, whether that path is expected, and where delay may affect the customer.
See the dependency chain
Connect web services, APIs, databases, caches, and queues to the requests they support.
Find slow or failing paths
Look for latency, congestion, retries, or packet loss that can stretch response times.
Name the boundary
A company-internal call can still cross a cloud account, network segment, or provider boundary.
02 / Treat access deliberately
Internal does not mean trusted
A compromised workload may be able to reach other systems through existing connections. Identity checks, least privilege, and segmentation help limit that reach. A newly observed connection is a reason to investigate its owner and purpose, not proof of an attack.
Verify the workload
Use service identity and context to decide which caller may access a resource.
Allow only what is needed
Document expected paths, such as checkout reaching its inventory API and database.
Reduce lateral reach
Separate systems and permit only the service connections required for the work.
Review changes with context
Check release timing, retries, and service ownership before changing a policy.
Practical rule: A map shows a path. The service owner and application context help explain whether it belongs.
03 / Build useful visibility
Start small. Add context.
Choose one important application and one question. Combine connection records with logs or traces over a clear time window, then review the findings with the service owner. Collecting every packet is rarely the only way to begin.
Pick one question
Example: which services does checkout call when order volume rises?
List components
Note APIs, databases, caches, queues, and the people who own them.
Gather a practical view
Use flow records, platform logs, and application telemetry for context.
Check expected paths
Relate changes to releases, retries, congestion, or unfamiliar access.
Agree on next steps
Confirm what is normal, what needs attention, and retention needs.
Flow records show endpoints, timing, and volume. Logs and traces add application meaning. Selective packet inspection can answer a specific question; balance its value against overhead and privacy needs.
04 / Follow the customer request
One click. Several conversations.
A page can look quiet while a distributed application coordinates behind it. Pairing network observations with traces connects those calls to the experience a customer sees.
05 / Account for changing paths
Cloud and containers move the picture
Services may move between hosts, share a machine, or communicate through overlays and provider-managed networks. A view focused only on the physical perimeter can miss workload-to-workload exchanges. Use workload identity and application telemetry to keep the map meaningful as addresses and deployments change.
More calls, more dependencies
Distributed designs increase service-to-service interactions and make dependencies more dynamic.
Look beyond the perimeter
Same-host traffic and software-managed paths may not appear in a hardware-only view.
Connect network and app signals
Combine telemetry with logs, metrics, traces, and named service owners.
Traceability / From signal to decision
Turn a traffic change into a useful answer
Keep the habit operable: Review a small set of critical services regularly. The right monitoring and control approach depends on architecture, risk, performance, privacy, and what your team can maintain.
What East-West Traffic Tells You About an Application
East-west traffic is communication between systems inside a defined environment, such as services in a data center, workloads in a cloud, or devices on an enterprise network. North-south traffic generally enters or leaves that environment. The labels describe direction across a boundary, not whether a connection is safe.
Think of a small bakery’s online shop. A visitor’s request comes in from outside; that is north-south traffic. Behind the counter, the web server asks the inventory service whether a cake is available, then the inventory service checks a database. Those internal calls are east-west traffic, even though none of them look like a person opening a web page.
The boundary matters. If a service in one cloud account calls a service in another, that communication may be internal to the company but cross a cloud or network boundary. A useful description says which boundary you mean: inside one application, one network segment, one cloud account, or the broader organization.
Distributed applications make these exchanges easy to overlook. One user action may trigger several calls among web servers, APIs, databases, caches, and queues. A traffic view helps you ask which service called which dependency, whether the call was expected, and whether its delay affected the customer’s experience.
As an affiliate, we earn on qualifying purchases.
Why Internal Connections Still Need Security Rules
East-west traffic matters for security because an internal connection can give one workload access to another system, and a network’s location does not prove that the caller is trustworthy. If an account or service is compromised, clear identity checks and limited permissions can make it harder for that access to spread.
Imagine a laptop used to manage a test server. The test server also has an old, broad connection to a production database. If someone takes over the test server, that open path could create a problem beyond the test environment. A map showing the connection does not prove an attack is happening; it gives the team a concrete question to investigate: does this service still need that access?
Security teams often use least privilege to grant only the access a workload needs, and segmentation to separate systems that should not freely communicate. Microsegmentation applies those ideas at a finer level, such as allowing a web service to reach one API while blocking unrelated connections. These controls can reduce a compromised system’s reach, but policies that are too strict can also interrupt legitimate work.
For everyday planning, start with known application needs and named owners. If a payroll service is expected to reach a payroll database on a specific path, document that relationship and review it when the application changes. Treat unexpected access as a prompt to check context, not as proof of malicious activity.
east-west traffic analysis software
As an affiliate, we earn on qualifying purchases.
As an affiliate, we earn on qualifying purchases.
How to Map Service Connections Without Collecting Everything
To map east-west traffic, begin with one important application, identify its expected dependencies, and combine a few useful data sources over a clear time window. You can often learn enough from connection metadata and application records without saving every packet or payload.
- Pick one application and one question. For example: “Which services does checkout call when order volume rises?” A focused question keeps the map manageable.
- List the known components. Note web services, APIs, databases, caches, queues, and their owners. A service diagram or deployment inventory can provide a starting point.
- Collect a practical view of connections. Flow records can show communicating endpoints, timing, and traffic volume. Platform or firewall logs may show allowed and blocked connections; endpoint and application telemetry can add process or request context.
- Compare the observed paths with expected behavior. If checkout calls the inventory service twice as often as expected, ask whether a release changed the request pattern or whether retries are piling up.
- Review the picture with the service owner. Confirm what is normal, what needs attention, and how long the records should be retained.
Suppose a home lab has a dashboard, a media server, and a backup machine. Watching a week of connection records may show that the dashboard contacts the backup machine even though nobody remembers setting up that relationship. That is a useful discovery to check; the traffic record alone cannot tell you whether it is an old feature, a configuration mistake, or a problem.
There is a tradeoff between detail and overhead. Selective visibility can make routine monitoring easier to operate and limit needless collection, while deeper packet inspection may help with a specific troubleshooting or security question. Choose the level that matches your systems, risks, performance needs, and privacy requirements.
network segmentation security products
As an affiliate, we earn on qualifying purchases.
As an affiliate, we earn on qualifying purchases.
Why Cloud and Containers Can Hide the Real Path
East-west traffic can be harder to see in cloud and container environments because services may move, share hosts, or communicate through software-managed network layers. A view focused only on the physical perimeter may miss exchanges that happen between workloads on the same machine or through provider-managed infrastructure.
Consider a shop whose checkout service runs in a container. A deployment may replace that container with a new instance, give it a different address, and send its requests through an overlay network. A simple list of fixed IP addresses can become stale while the application still works. To make sense of the flow, you may need service names, workload identity, or orchestration records alongside network data.
Cloud and hybrid environments add boundaries of their own: a service can be internal to the application but cross between accounts, regions, providers, or a company network and a cloud. Asking “is data moving inside which boundary?” gives a more useful answer than labeling the entire organization as one flat interior.
Service meshes can help manage service-to-service identity, encryption, and policy, but they add components and operating work. They are one option, not a requirement. A smaller environment may get what it needs from cloud flow records, firewall logs, and clear service ownership, while a large, fast-changing platform may need richer workload-level visibility.
application dependency mapping tools
As an affiliate, we earn on qualifying purchases.
As an affiliate, we earn on qualifying purchases.
How to Tell a Performance Problem from a Security Signal
East-west traffic gives you clues about what systems are doing, but a traffic spike or unfamiliar connection does not explain itself. Compare network patterns with application latency, errors, deployment changes, and service ownership before deciding what action fits.
| What you notice | Possible performance explanation | Useful next question |
|---|---|---|
| More calls from checkout to inventory | A release may have added repeated lookups, or retries may be increasing. | Did request volume or the code change around the same time? |
| Long delays between an API and its database | Congestion, database load, poor routing, or a dependency slowdown may be involved. | Do traces show where the request starts waiting? |
| A workload contacts a new internal service | A planned deployment or configuration update may explain the path. | Does the service owner recognize this dependency? |
| Repeated attempts to reach a blocked system | A stale setting or a broken dependency may be retrying. | Is the destination required, and what generated the attempts? |
For example, an online store may see slower checkout just after a deployment. Flow data shows a jump in calls to the stock service, while an application trace reveals that each page request now makes several repeated checks. The traffic map points the team toward the dependency; the trace helps explain the delay.
Security and performance can overlap. A sudden change may reflect a legitimate software update, a noisy retry loop, or an unauthorized connection. Correlation provides context, but it does not prove cause by itself. Check timestamps, changes, service owners, and the exact access policy before changing a rule that could interrupt a working application.
Build a Monitoring Habit Your Team Can Maintain
A maintainable east-west monitoring habit starts with a small number of critical services and a short list of questions you review regularly. It connects network observations to the people and applications that can explain them, instead of creating a mountain of records with no clear purpose.
Take a payment service as an example. The team might track its expected database and fraud-check dependencies, watch for changes in request volume or latency, and review unusual connections when a deployment occurs. If a payment provider call crosses the organization’s boundary, naming that boundary helps everyone interpret the record correctly.
Use the signals that answer the question at hand. Flow records can show endpoints and volume; application logs can capture errors; distributed traces can show how a request traveled among services. When encryption protects the contents of a connection, passive inspection may not reveal the payload, but timing, endpoints, and volume can still help. Authorized endpoint or application telemetry may add context without weakening encryption.
Set a review rhythm that fits the service. A fast-changing platform may benefit from automated alerts for unexpected dependencies, while a stable home lab may only need a monthly check of its key connections. In either case, record who owns each service and what “normal” means. That small bit of context can save time when a green dashboard suddenly turns red.
Choose Access Controls That Fit Your Architecture
The right east-west controls depend on how many services you run, how quickly they change, and how much operational complexity your team can support. A simple network rule may suit a small, stable system; a larger platform may need identity-aware policies that follow workloads as they move.
For a home lab with a file server, a media machine, and a backup device, separate network segments and a short allowlist may be easy to understand. If the media machine only needs to read one shared folder, you can avoid giving it broad access to the backup system. The written rule is useful because you can check it later when a new device joins.
In a larger container platform, workload identity can tie a policy to a service rather than a changing address. A service mesh may authenticate and encrypt service-to-service requests, while cloud controls may handle boundaries between accounts or networks. Those tools can make policy more consistent, but they also require configuration, monitoring, and people who can troubleshoot them.
Zero-trust thinking fits this work by asking you to verify identity and context instead of trusting a connection because it came from “inside.” It does not mean blocking everything by default without a plan. Start from the application’s real dependencies, make the smallest workable policy, and check how the service behaves before applying changes broadly.
Turn the Traffic Map into a Better Operational Decision
A traffic map becomes useful when it helps you make a decision about a service, a change, or a connection. A diagram full of arrows can look impressive, but it earns its place when it helps answer: what calls this service, what changed, where does a request slow down, and who can confirm the dependency?
Imagine a team planning to retire an older reporting service. A connection map shows that a monthly billing job still calls it, even though the service no longer appears in the team’s current architecture notes. Before shutdown, the team checks the job owner and confirms whether that call is still needed. The map prevents an avoidable outage because it exposes a dependency that lived outside the obvious user-facing path.
Keep the map tied to service names and owners where you can, and mark the date or time window behind the observations. A connection seen once during a maintenance window may not represent ordinary use. Likewise, an absence in a short capture does not prove that a rarely scheduled job has no dependency.
Pairing network telemetry with application traces and service ownership makes the picture easier to interpret. Traffic shows that systems communicate; application context helps explain why. That distinction keeps your response practical, whether you are investigating a slow request, reviewing a new policy, or planning a change to a system your customers rely on.
Frequently Asked Questions
What is east-west traffic?
East-west traffic is communication among systems or workloads inside a defined environment, such as a data center, cloud environment, or enterprise network. A web service calling an internal database is one example. The exact label depends on the boundary you are using.
How does east-west traffic differ from north-south traffic?
North-south traffic generally crosses into or out of an environment, while east-west traffic moves between systems within it. A browser request entering a company service is often north-south; a service calling an internal cache is often east-west. A flow can be internal at one layer and cross a boundary at another.
Is all internal traffic safe?
No. An internal connection may be necessary, unnecessary, misconfigured, or unexpected. A compromised workload can sometimes reach other systems, so identity checks, limited access, and segmentation help reduce its reach.
Does encryption make east-west traffic impossible to monitor?
No. Encryption protects payload contents from passive inspection, but records may still show endpoints, timing, and volume. Application traces, logs, and authorized endpoint telemetry can add context when you need to understand what a service was doing.
What should I monitor first?
Pick a critical application and one practical question, such as which services checkout calls when latency rises. Start with its expected dependencies, then compare flow records with application logs or traces. A focused view is easier to explain and act on than a large collection of unconnected data.
Do I need a service mesh to manage east-west traffic?
No. A service mesh is one way to manage service identity, encryption, and policy, especially in dynamic platforms. A smaller or more stable environment may get enough visibility and control from network rules, flow records, platform logs, and clear service ownership.
Conclusion
Think of east-west traffic as the conversation that lets your applications do their jobs. Learn which systems need to talk, watch for changes that matter, and give each connection only the access its work requires.
Start with one service you care about and draw its real dependencies. A clear map can turn a blur of network activity into a simple question—and a better next step.
Halloween Picks
halloween
As an affiliate, we earn on qualifying purchases.